Forts of Maharashtra
Data Visualization Project
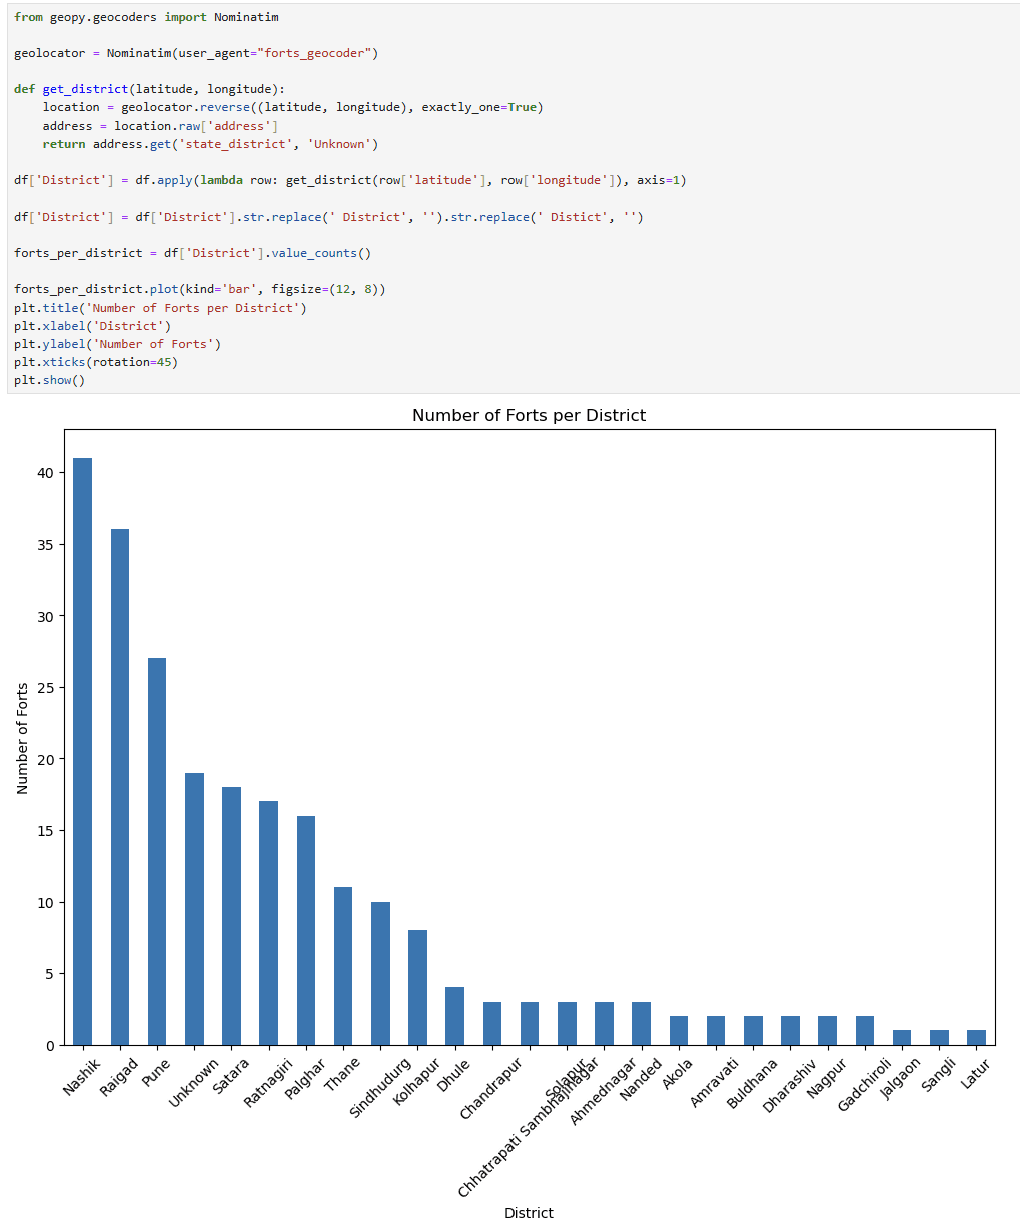
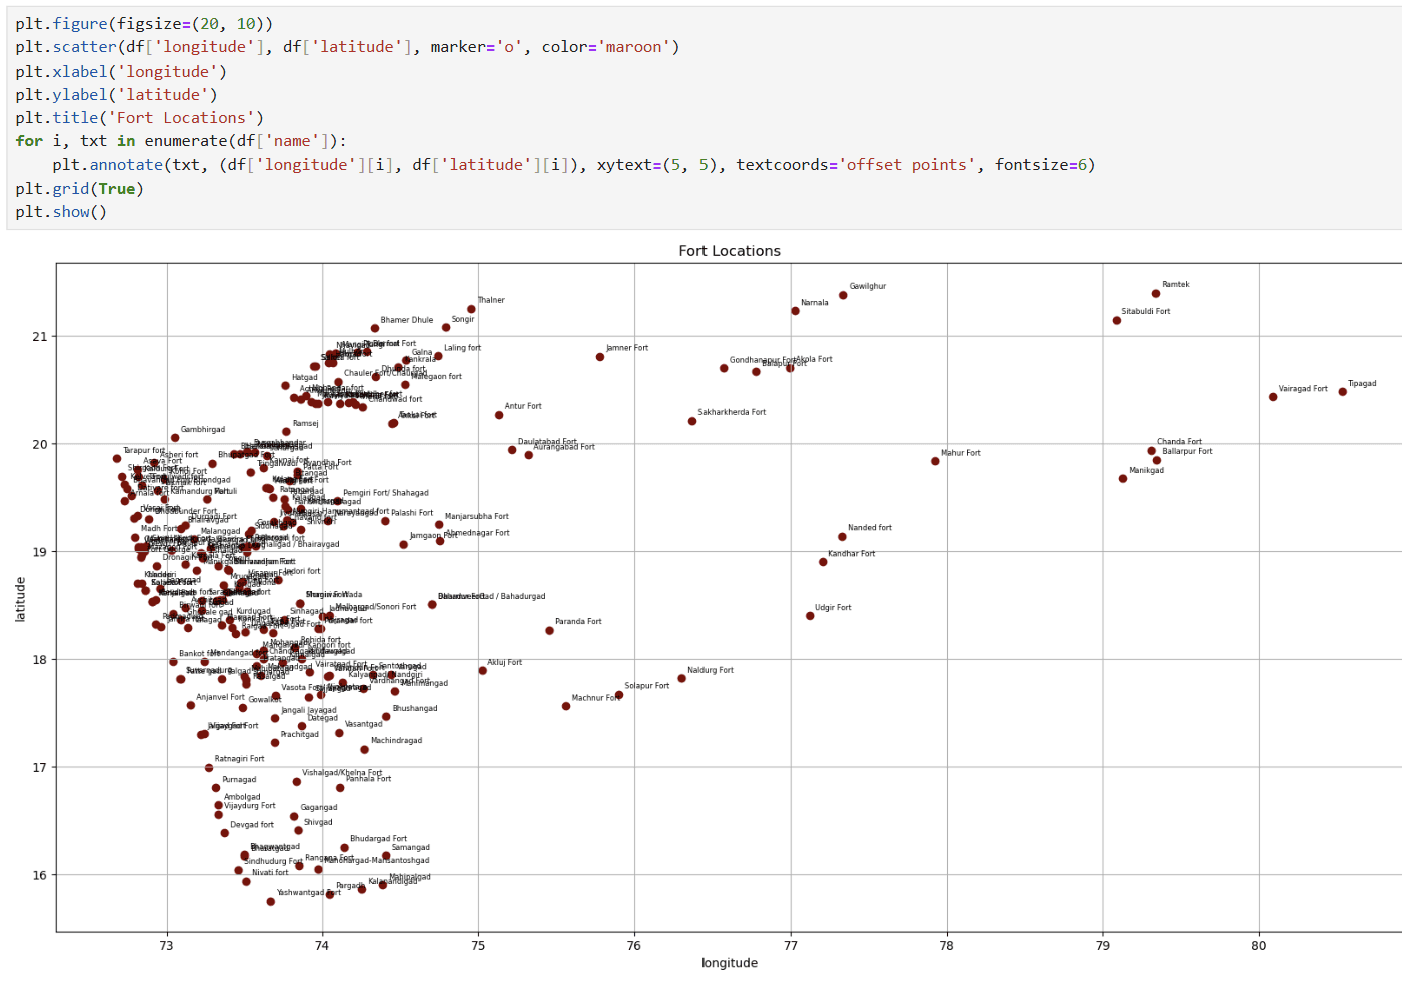
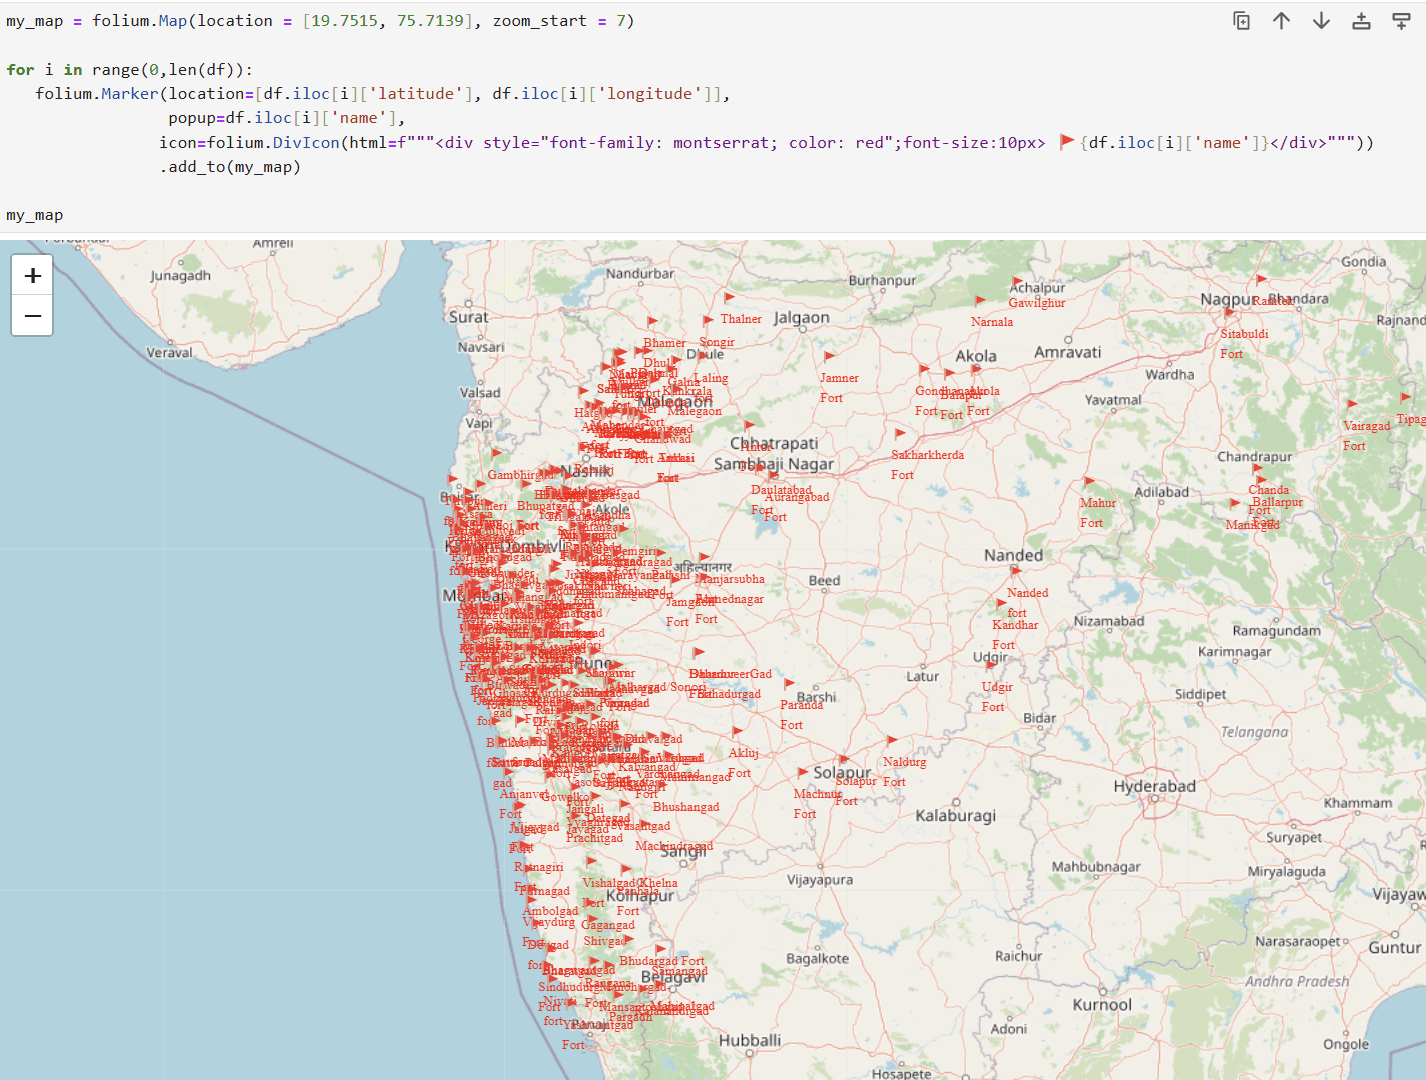
I explored various forts in Maharashtra by analyzing and visualizing data. The dataset included information like the name of each fort, its location, height, and type. I started by cleaning the data and then looked into a few key questions, like:
I used libraries like Pandas for data processing, Matplotlib and Seaborn for visualizations, and Folium to show the geographical locations of the forts on a map.
- How many forts are there in each district?
- How does the distribution of forts look?
- How does the height of forts vary?
I used libraries like Pandas for data processing, Matplotlib and Seaborn for visualizations, and Folium to show the geographical locations of the forts on a map.
Course
Data Science Labs
Advisors
Anil Kadam
Duration
2 weeks
Tools
Jupyter, Kaggle